Field notes on Phoenix water.
Written by the team that tests, installs, and services these systems every week. Plain English, no SEO filler.
Phoenix tap water sources: CAP, SRP reservoirs, and groundwater explained
Phoenix metro tap water comes from three different source categories blended in ratios that shift by city, zone, and season. Here is what each source looks like and what it means for your filtration system.

Lead in Phoenix Metro Tap Water: What the EPA's 2024 Rule Changes Mean for Arizona Homeowners
Lead risk in Phoenix area homes comes primarily from household plumbing, not the water supply. The EPA finalized the Lead and Copper Rule Improvements in October 2024, lowering the action level from 15 ppb to 10 ppb and requiring utilities to inventory every service line. Here is what changed and what Maricopa County homeowners should know.

Scottsdale North Valley Water Quality 2026: PFAS Detections and Water Hardness by Area
DC Ranch, Grayhawk, Desert Ridge, Pinnacle Peak, McCormick Ranch, and Kierland are served by Scottsdale Water on a blended CAP and SRP supply that typically measures 12 to 16 GPG hardness. Here is what EPA UCMR5 monitoring and the City of Scottsdale Consumer Confidence Report show about PFAS and hardness in North Valley zones.

Maricopa County Tap Water Quality: What Phoenix Homeowners Are Actually Drinking in 2025
Phoenix water comes from the Colorado River and Salt River Project, arrives chloraminated, and tests at 150 to 250 mg/L hardness. Here is what the City of Phoenix Consumer Confidence Report and EPA data show about what is actually in your tap water.

Disinfection Byproducts in Phoenix Metro Drinking Water: What TTHM and HAA5 Data Show
Phoenix utilities use chloramine rather than free chlorine to limit total trihalomethanes. The 2023 Consumer Confidence Report shows TTHMs at approximately 18 ppb and HAA5s at approximately 12 ppb, both well under EPA limits. Here is what the data means for Phoenix metro households.

Arizona's PFAS Monitoring Data: What the EPA UCMR5 Results Show for Phoenix Metro Water Utilities
The EPA's fifth Unregulated Contaminant Monitoring Rule required Arizona water utilities serving more than 3,300 people to test for 29 PFAS compounds between 2023 and 2025. Here is what the program found, what the April 2024 MCL rule requires, and how Phoenix metro homeowners can look up their utility's results.

What Is in Phoenix Tap Water? A 2024 Data Summary for Metro Homeowners
Phoenix water meets all federal Safe Drinking Water Act standards, but 2024 Consumer Confidence Reports, EWG data, and EPA UCMR monitoring reveal a detailed picture across seven contaminant categories. Here is what the public data shows for Phoenix metro homeowners.

Maricopa County water hardness by city: what the 2024 Consumer Confidence Reports show
Municipal Consumer Confidence Reports show Phoenix metro tap water ranges from 10 to 25 grains per gallon depending on city and water source. Here is what the data means for your home.

Arsenic in Arizona Drinking Water: What Phoenix Metro Homeowners Need to Know
Arsenic occurs naturally in Arizona's volcanic geology and reaches both groundwater wells and some municipal supplies across the Phoenix metro. The EPA maximum contaminant level is 10 parts per billion. Phoenix and Scottsdale city water come in well below that limit on current CCR data, but private well owners in Maricopa County face unregulated groundwater where arsenic concentrations can exceed 100 ppb in some aquifer zones.

PFAS in Phoenix Drinking Water: What the 2024 Monitoring Data Shows
Phoenix Water Services monitored for 29 PFAS compounds under EPA UCMR5 from 2023 to 2025. The April 2024 MCL rule set enforceable limits at 4 ppt for PFOA and PFOS, with a compliance deadline of 2029. What the data shows and what filtration removes PFAS at the kitchen tap.

PFAS in Phoenix tap water 2026: ADEQ and EPA detection data
Phoenix Water Services draws nearly all of its supply from the Salt and Verde rivers, giving it a different PFAS risk profile than groundwater-reliant Maricopa County systems. Here is what EPA UCMR 5 data and ADEQ monitoring show for Phoenix area tap water in 2026.

Maricopa County Water Quality by City: HAA5, TTHM, and PFAS Compared
Phoenix, Scottsdale, Mesa, Chandler, Tempe, Gilbert, Peoria, and Surprise all show different HAA5, TTHM, and PFAS profiles based on source water blend and disinfection chemistry. This guide compares EPA UCMR 5 data and Consumer Confidence Report values across the county so you know what is actually in your city's tap water.

Chandler AZ Water Quality 2026: East Valley Hardness, Chloramine, and What to Do About It
Chandler draws from three sources including CAP Colorado River water, SRP Salt and Verde River surface water, and East Valley groundwater wells, producing hardness ranging from 12 to 18 grains per gallon depending on your supply zone and the season.

PFAS in Maricopa County drinking water: what the data shows
EPA UCMR 5 data detected PFAS in several Arizona water systems. Here is what Phoenix metro homeowners need to know about their tap water in 2026.

Surprise, AZ Water Quality 2026: Northwest Valley Hardness and What You Can Do About It
Surprise draws from Colorado River water delivered through the Central Arizona Project and deep West Valley groundwater wells, producing some of the highest hardness readings in the Phoenix metro at 15 to 20 grains per gallon depending on your supply zone.

Whole-Home Water Filtration in Phoenix: Catalytic Carbon, Sizing, and Filter Life
Phoenix Water Services uses chloramine as its disinfectant. That single detail changes which carbon filter actually works at the main line. This guide covers catalytic vs standard GAC, flow-rate sizing, filter life at Arizona usage rates, and how to pair a carbon filter with a water softener.

Glendale, AZ Water Quality 2026: What the CCR and Public Data Show
Glendale tap water comes from the Colorado River, measures approximately 12.7 grains per gallon of hardness, and carries nine contaminants that exceed EWG health guidelines. Here is what the public data documents for the city's 246,000 residents.

Tempe, AZ Water Quality: What the CCR Shows and What Homeowners Should Know
Tempe tap water blends SRP and CAP surface water, runs 14 to 20 grains per gallon of hardness, and carries PFAS and disinfection byproducts that exceed EWG health guidelines. Here is what the public data documents.

Gilbert, AZ Water Quality 2026: What the Town CCR and East Valley Data Show
Gilbert draws from four source inputs, runs water through two treatment facilities, and documented PFAS detections at the North Water Treatment Plant in the 2024 Consumer Confidence Report.

How to Read Your Phoenix or Mesa Consumer Confidence Report
The annual CCR tells you exactly what is in your tap water. Here is how to read the numbers, and what to do about them.

Phoenix Water Softener Maintenance: Annual Checklist for Arizona Homes
Phoenix water runs 12 to 22 GPG. At that hardness, your softener works harder than average. Here is the annual maintenance checklist every Phoenix homeowner needs to keep it running at peak.

Peoria, AZ Water Quality: What Your Treatment Plant Is Actually Delivering
Peoria operates two treatment plants with different hardness outputs: 13 GPG from Greenway and 17 GPG from Pyramid Peak. Your address determines which one feeds your taps.

Chandler, AZ Water Quality: What the CCR Shows and Why Reverse Osmosis Makes Sense
Chandler tap water averages 16.5 grains per gallon of hardness and uses free chlorine for disinfection. Here is what the Consumer Confidence Report documents and what filtration addresses it.

How to Read Your Phoenix Water Quality Report: A CCR Explainer for Homeowners
Every Phoenix and Mesa homeowner receives an annual Consumer Confidence Report. Most recycle it. Here is how to read it, what each column header means, and how the numbers in your CCR compare to EPA, EWG, and USGS benchmarks.

Reverse Osmosis in Phoenix: What It Removes, How It Works, and What to Expect
Phoenix tap water averages 550 to 700 ppm total dissolved solids, carries documented PFAS detections, and tests above EPA-set arsenic levels in prior reporting periods. A four-stage reverse osmosis system at the kitchen sink addresses all of it at the point where you drink and cook.

Ahwatukee vs Chandler Water Hardness: Which Maricopa County District Has Harder Water?
Ahwatukee runs 19 to 22 GPG on Phoenix Water's SRP-heavy southern supply. Chandler runs 14 to 19 GPG on a blended CAP, SRP, and groundwater supply. Both exceed the USGS very-hard threshold, but the gap between them determines sizing, treatment choices, and appliance risk timelines.
Scottsdale Water Quality 2026: Sources, Hardness Data, and What the Annual Report Shows
Scottsdale is the largest municipal CAP water contractor in Arizona. Its supply from Lake Pleasant and the Salt River blends into one of the Phoenix metro's more complex water profiles. Here is what the city's Consumer Confidence Report shows.

Hard Water in Mesa and Ahwatukee: What City Data Shows and What to Do About It
Mesa and Ahwatukee run 18 to 22 GPG, among the highest hardness levels in the Phoenix metro. Here is what City of Mesa and Phoenix Water reports document and what treatment actually works at those levels.
Phoenix Water Hardness by Neighborhood: What Your Zip Code Gets
Phoenix water hardness ranges from 14 GPG in some Gilbert and Queen Creek neighborhoods to 24 GPG in Peoria groundwater zones. Here is the hardness profile for 16 Phoenix metro cities, why it varies, and when it becomes a treatment decision.

How Much Does a Water Softener Cost in Phoenix? 2026 Pricing Guide
Phoenix homeowners pay above the national average for water softener installation. Here is why and what to budget for every scenario.

Hard Water Appliance Damage in Phoenix: What Is at Risk in Your Home
Phoenix water runs 12 to 22 GPG. Here is what that mineral load does to water heaters, dishwashers, washing machines, and plumbing over time.

Phoenix Water Quality Report 2026 Decoded: What the Numbers Actually Mean
Phoenix publishes an annual Water Quality Report under the Safe Drinking Water Act. Here is how to read it and what the numbers mean for your household.
Chloramine in Your Phoenix Shower: What It Is and What to Do About It
Phoenix switched from chlorine to chloramine disinfection years ago. Here is what that means for your shower experience and your household air quality.
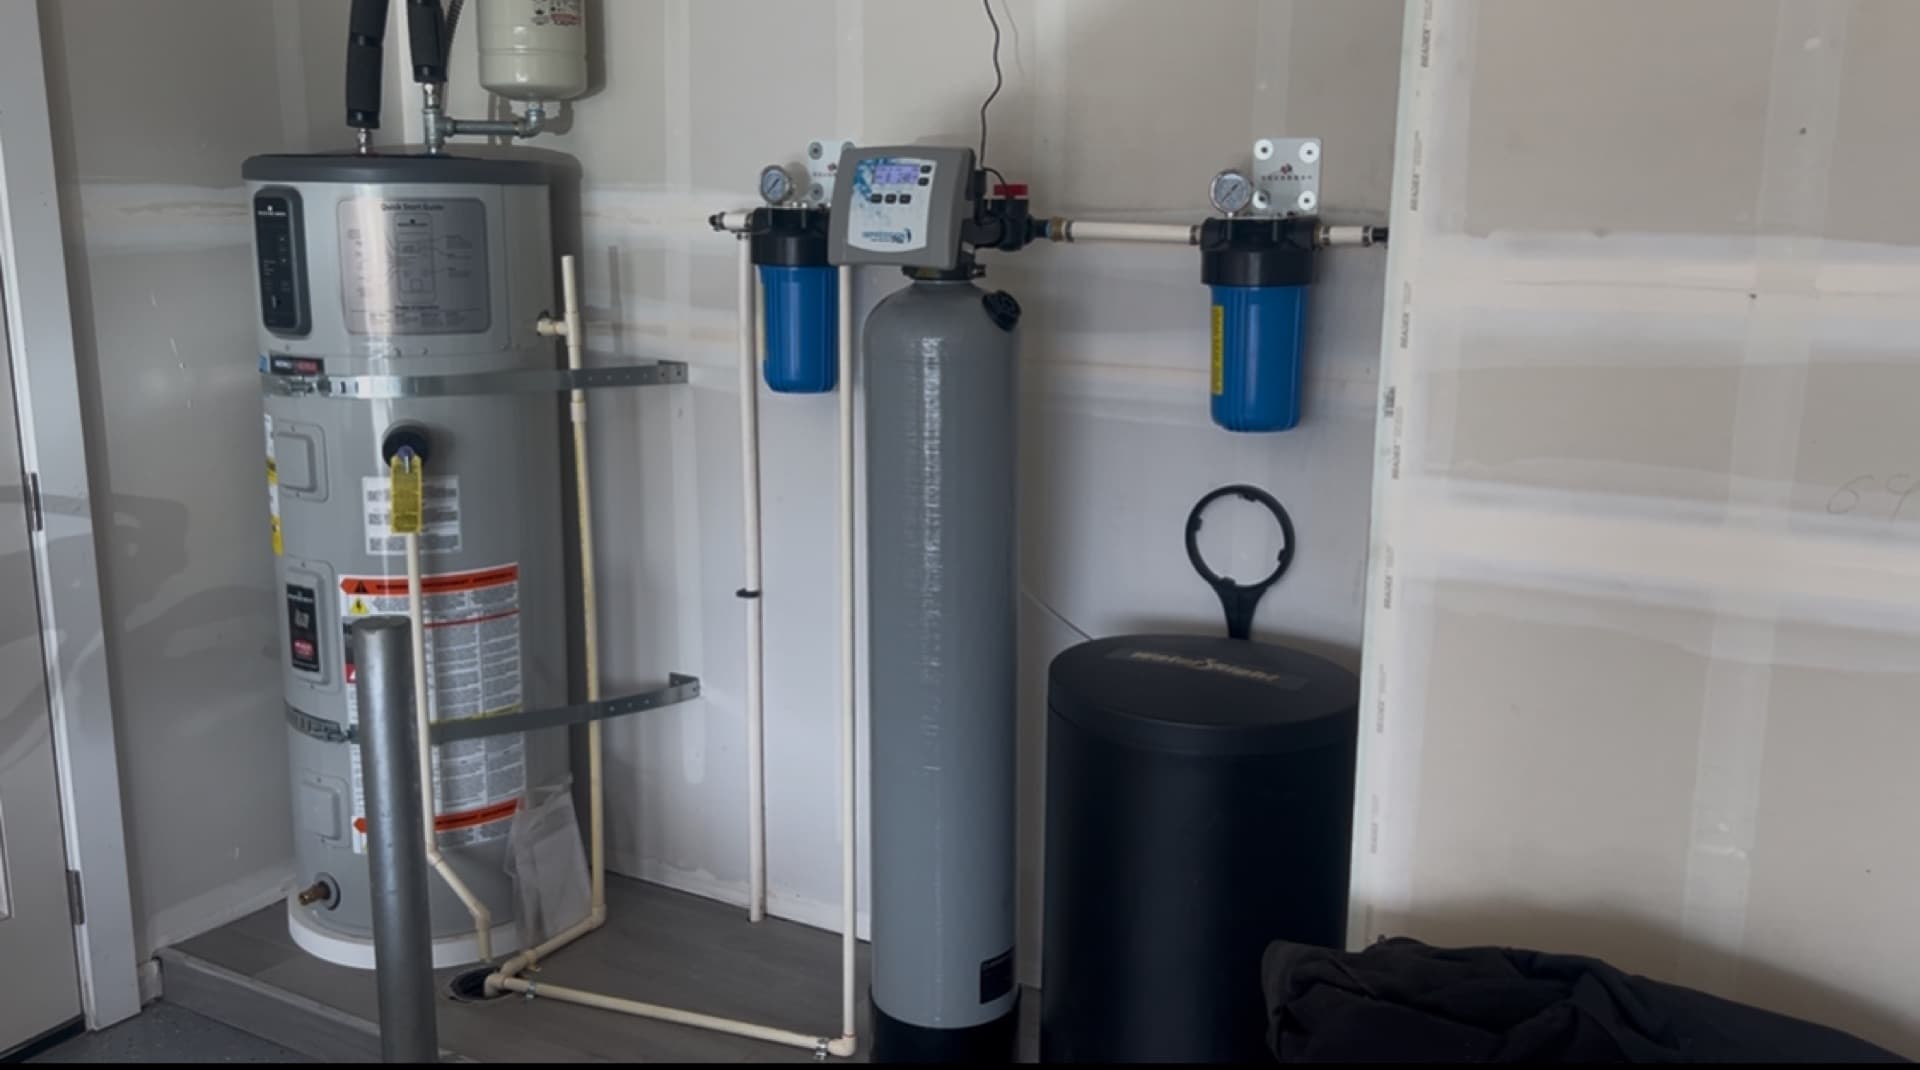
Water Filtration for New Construction in Phoenix: What to Install Before Moving In
New Phoenix homes ship with builder-grade plumbing and no water treatment. Here is the right system, the right sequence, and the right time to install it.

Your wellness stack starts with the water in the glass
Sleep, sauna, supplements, HRV, and the most-used input in your daily life is whatever the city sends to the curb.

Mineralized RO vs bottled spring water: what's actually in the glass
We tested seven popular premium waters against our own remineralized RO. The numbers are not subtle.

Phoenix tap water in 2026: what's actually in it
The 2024 Phoenix Water Quality Report and the EWG database, read by someone who tests Phoenix water for a living.

Salt softener or no-salt conditioner: which works in Phoenix?
A direct comparison of the two technologies, written for someone deciding between them.
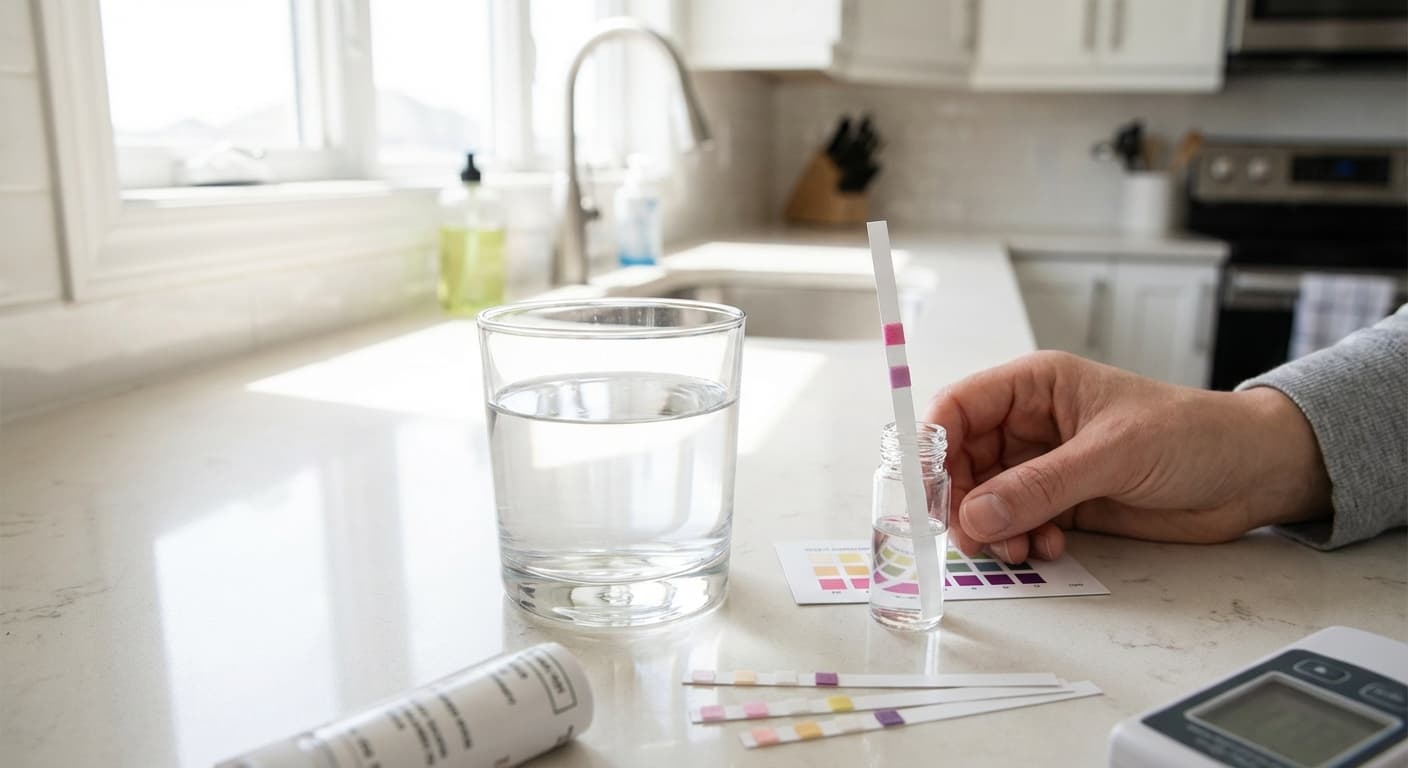
PFAS in Arizona water: what's known, what to do
PFAS detections in the Phoenix supply are real. Here's what's being tested for, and what filtration actually removes it.

What a 4-hour install actually looks like
Drop cloths at 9, water back on by 1. Here's the play-by-play.

Well-water iron and sulfur: what to do about the smell
Rotten-egg smell, orange staining in toilets, metallic taste, and the train of equipment that fixes them.